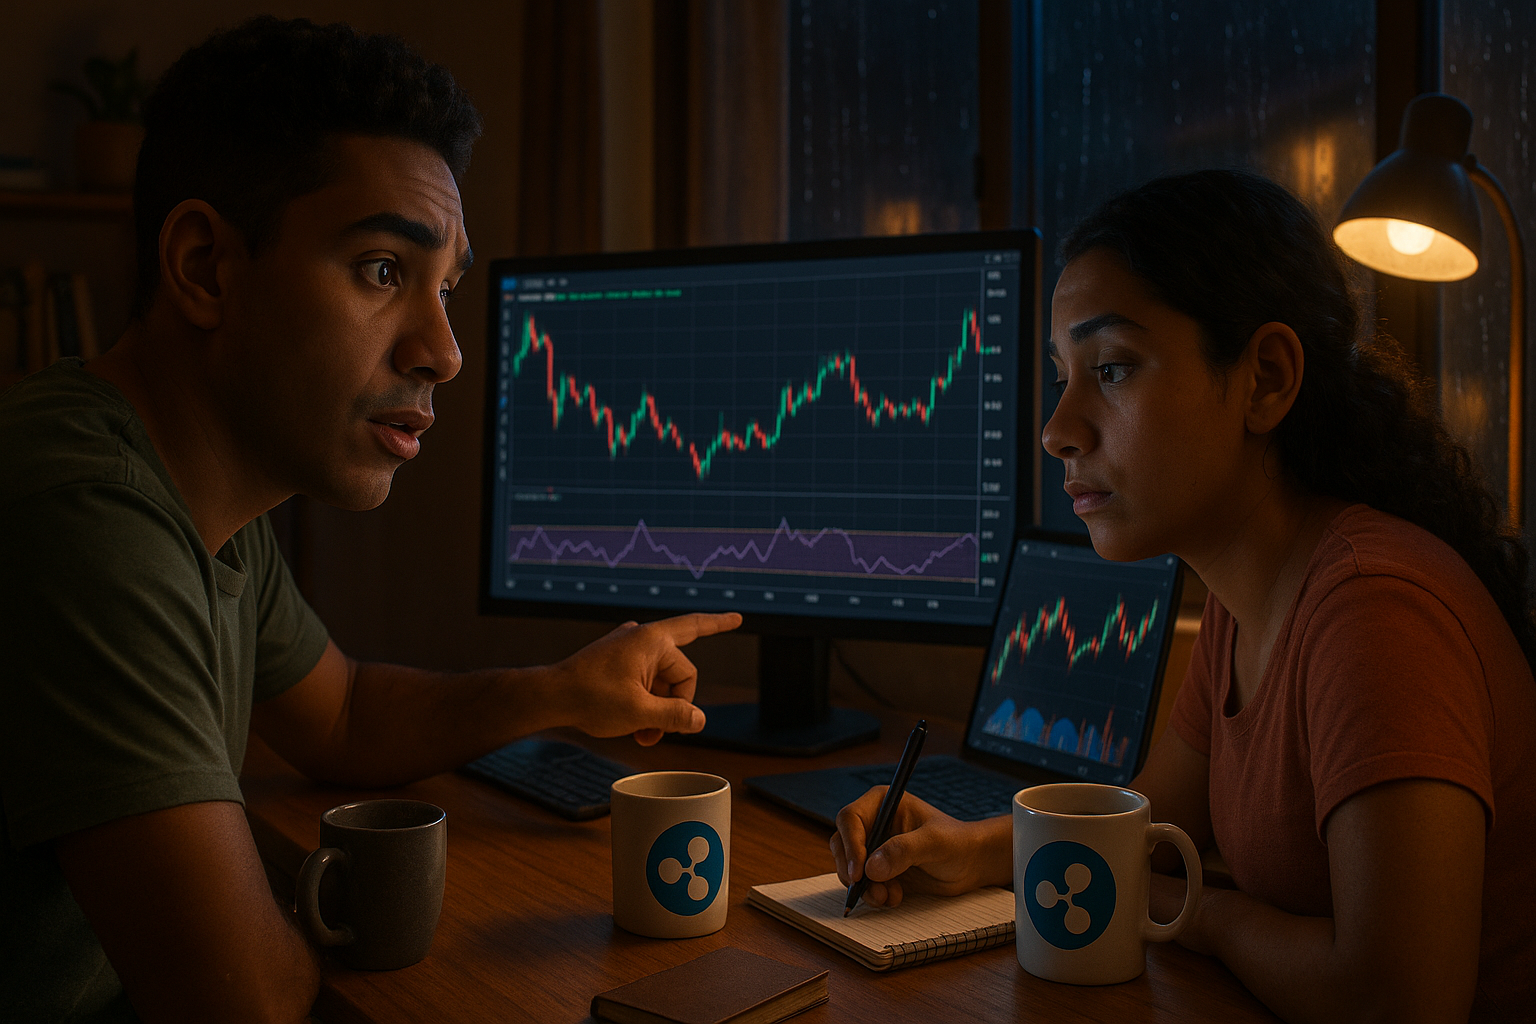
This signal on the XRP chart hasn’t appeared in 13 years
XRP, the cryptocurrency from Ripple, saw its two-week Relative Strength Index (RSI) plummet to the lowest level ever recorded since the asset’s launch 13 years ago. This rare technical signal comes after a series of declines that pushed XRP’s price to trade near $0.49, reigniting debate among analysts about whether the token has reached a cycle bottom.
What is RSI and why is this level relevant?
The RSI is an indicator used by traders to measure the degree of overbought or oversold conditions of an asset. Values below 30 usually indicate oversold conditions, suggesting the asset may be close to a trend reversal. In XRP’s case, the two-week RSI has dropped to a level never seen before in the coin’s history, signaling extreme selling pressure.
Such a low reading is rare among established cryptocurrencies and, historically, can precede recovery moves. However, the macroeconomic context and specific factors in the XRP market also need to be considered before drawing any conclusions about a cycle reversal.
Recent history and XRP context
XRP has faced a volatile path in 2026, pressured by factors such as the prolonged regulatory dispute between Ripple and US regulators, as well as changes in global risk appetite. The asset traded above $1.29 at the start of the year, but has posted significant losses in recent weeks, mirroring the widespread caution in the crypto market.
Despite the challenging scenario, XRP maintains one of the largest market capitalizations in the sector, with a significant presence in international transfers and liquidity solutions. The recent RSI movement may attract investors watching for signs of seller exhaustion, but sentiment remains uncertain regarding a bullish recovery.
Impacts for investors and next steps
For those following XRP, the new negative RSI record on the two-week chart serves as a warning for possible price direction changes, but does not automatically guarantee a reversal. Technical analysts recommend monitoring volume behavior, possible confirmations from other indicators, and news involving Ripple, especially regarding the progress of legal proceedings and institutional adoption.
If the historically low RSI does indeed signal a bottom, XRP could attempt a moderate recovery. However, the lack of clear positive triggers and a more restrictive macroeconomic environment suggest caution for those seeking short-term trades.
What to watch next
In addition to the RSI, investors should monitor XRP’s main technical supports, especially the $0.45 region, and possible moves by large wallets (“whales”) in the market. The outcome of regulatory negotiations and any strategic partnerships by Ripple could also influence price direction in the coming months.
Want to trade crypto with AI support? Check out Zayion AI, the trading assistant from Bianchi Capital.
With information from BeInCrypto Brazil (September 2026).
Resultados e relatos reais de quem usa o Zayion
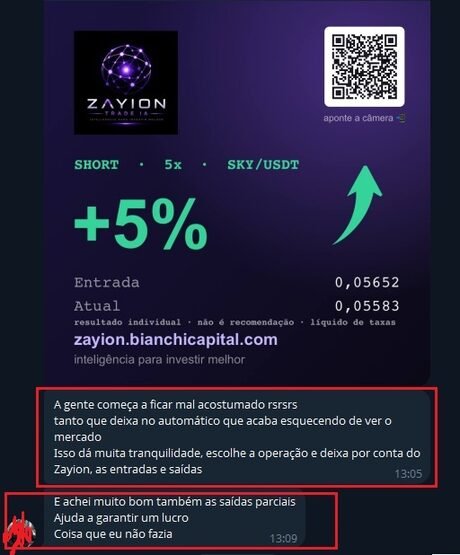
Sinal Zayion: SHORT SKY/USDT +5%
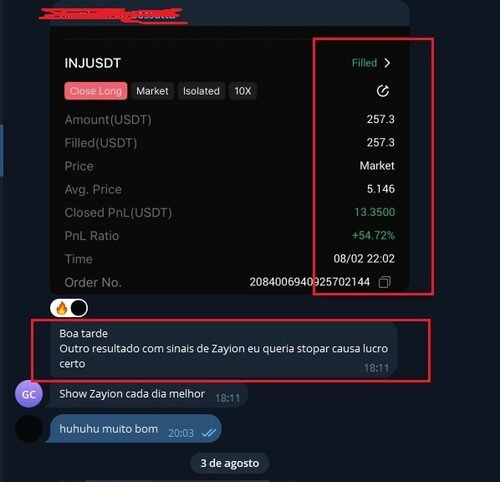
Operação fechada com +54,72% de PnL

Relato de usuário: “teve bons lucros realizados já”
Prints reais enviados por usuários. Resultados individuais e não representam garantia de rentabilidade. Conteúdo educacional, não é recomendação de investimento.
Quem escreve no CoinsFrontier
Alexandre Bianchi
Fundador da Bianchi Capital e do Zayion AI. ~10 anos no mercado de ativos digitais, autor de referência e presença na mídia.

Receba as melhores análises de cripto no seu e-mail
Automação, bots e sinais sem caixa-preta — direto no seu e-mail. Grátis.
Sem spam. Cancele quando quiser.
✅ Pronto! Confira seu e-mail (e a caixa de promoções) para confirmar.